
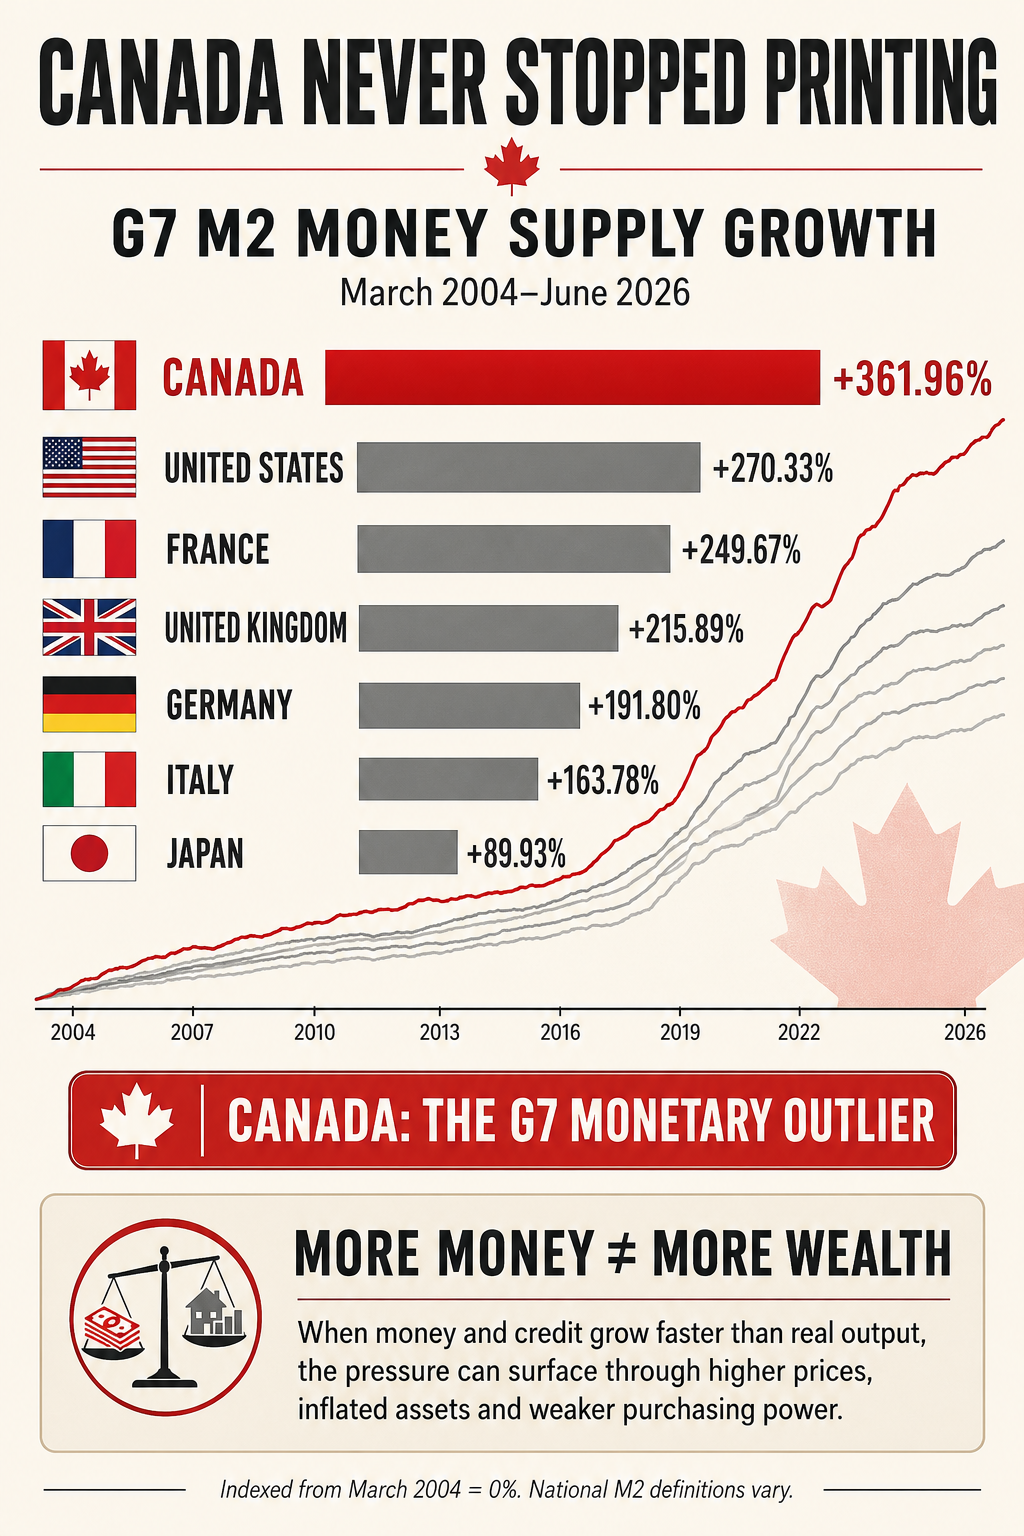
Canada has quietly become the monetary outlier of the G7.
A new chart tracking monthly M2 money supply shows Canada’s broad money stock increased approximately 361.96% between March 2004 and June 2026. That is the largest expansion among the Group of Seven economies—and considerably higher than the 270.33% increase recorded in the United States.
The chart’s message is difficult to miss: while other G7 countries eventually applied the brakes, Canada’s monetary expansion continued climbing.
Canada Breaks Away From the G7
Using March 2004 as a common starting point, the chart reports the following cumulative increases:
| G7 country | M2 growth since March 2004 |
|---|---|
| Canada | 361.96% |
| United States | 270.33% |
| France | 249.67% |
| United Kingdom | 215.89% |
| Germany | 191.80% |
| Italy | 163.78% |
| Japan | 89.93% |
Canada’s M2 expansion was approximately 92 percentage points greater than America’s and more than four times Japan’s increase.
The divergence became particularly dramatic after 2020. Money supplies expanded throughout the developed world as governments and central banks responded to the pandemic with emergency spending, asset purchases and extraordinary liquidity programs.
But the chart indicates that most G7 monetary aggregates subsequently flattened, slowed or contracted. Canada’s continued rising.
Is This Really “Money Printing”?
“Money printing” is useful shorthand, but it does not mean that the Bank of Canada physically printed every additional dollar.
M2 is a broad monetary aggregate that generally includes currency, chequable deposits, savings deposits and certain other highly liquid balances. Its growth can result from central-bank actions, commercial-bank lending, government deficits, deposit creation and changes in where households and businesses hold their money.
The Bank of Canada publishes several measures—including M2, M2+, M2++ and M3—because each captures a different portion of the financial system. Its broader M2++ measure also includes retail instruments and certain mutual-fund balances. Bank of Canada monetary aggregates
International comparisons therefore require caution. The precise definition of M2 is not identical in every country, and statistical revisions can affect long-term results. Even the U.S. Federal Reserve changed aspects of its monetary classifications in 2020. Federal Reserve M2 data and methodology
Nevertheless, the indexed chart identifies a meaningful trend: Canada’s pool of broadly defined domestic money has expanded far faster than those of its G7 peers.
More Money, But Not Necessarily More Wealth

A larger money supply is not automatically destructive. A growing economy needs additional money and credit to support a larger population, higher production and expanding commerce.
The central question is whether money growth is being matched by gains in real output.
When the quantity of money and credit rises faster than the economy’s ability to produce goods, services, infrastructure and housing, the adjustment can appear through higher consumer prices, inflated financial assets or declining purchasing power.
Canada’s experience is especially important because the country also underwent substantial population growth, a historic housing boom and increasingly high household debt. Newly created money did not flow evenly through the economy. Much of the credit expansion became connected to real estate, mortgages and financial assets.
That helps explain the Canadian paradox: households may possess more dollars in nominal terms while finding that those dollars buy less housing, food, transportation and financial security.
The Canadian Dollar Is the Real Scorecard
A currency does not lose purchasing power simply because its M2 supply increases. Interest rates, productivity, fiscal policy, trade balances, capital flows and demand for the currency all matter.
Still, persistent monetary expansion creates an important long-term question: What backs each additional Canadian dollar?
If money and credit grow alongside productive investment, new industry and rising output, the expansion can be absorbed. If they primarily finance consumption, deficits and competition for a limited stock of housing and assets, currency holders may bear the cost through dilution.
This does not necessarily produce an immediate currency crisis. Monetary debasement is often gradual. It becomes visible through the cumulative rise in living costs and the amount of currency required to purchase scarce assets.
Why Offshore Investors Should Pay Attention
For Canadians, the chart makes international diversification more than a search for higher returns. It becomes a form of currency-risk management.
Canadian investors commonly believe they are diversified because they own several Canadian stocks, bonds and real-estate holdings. But if those assets, their income and their future liabilities are all denominated in Canadian dollars, they remain heavily exposed to one monetary system.
Potential diversification instruments may include:
- Businesses earning revenue in multiple currencies
- International equities and bonds
- Foreign-currency cash reserves
- Global infrastructure and productive real assets
- Precious metals held as long-duration monetary insurance
- Carefully selected offshore jurisdictions with strong legal and custodial systems
Diversification does not require abandoning Canada or making a single dramatic currency bet. It means recognizing that domestic monetary exposure is itself a concentrated position.
The Bigger Warning
Canada’s 362% M2 expansion does not prove that inflation, currency depreciation or asset prices will move by the same percentage. Nor does it establish that every additional dollar was created directly by the central bank.
What it does reveal is the extraordinary scale of Canada’s monetary transformation.
Since March 2004, Canada has expanded its broad money supply more aggressively than any other G7 country shown in the chart. While its peers slowed after the pandemic-era surge, Canada continued along a steeper trajectory.
For investors, the issue is not merely how many Canadian dollars they possess. It is how much real value those dollars will command in the years ahead.
Editor’s note: The percentages cited are taken from the supplied chart through June 2026. National monetary aggregates can differ in composition and may be revised. This article is general information, not individualized investment advice.
Leave a Reply