For more than a century, silver has been quietly telling a story that few have bothered to calculate properly. Not the paper price quoted on COMEX screens, not the derivative-laden futures market, but the real ratio between money creation and physical metal. When you run the math honestly, the result is startling—and it explains why we are now entering what can only be described as The Great Silver Breakout.
From 1913 to Today: A Ratio That Tells the Truth
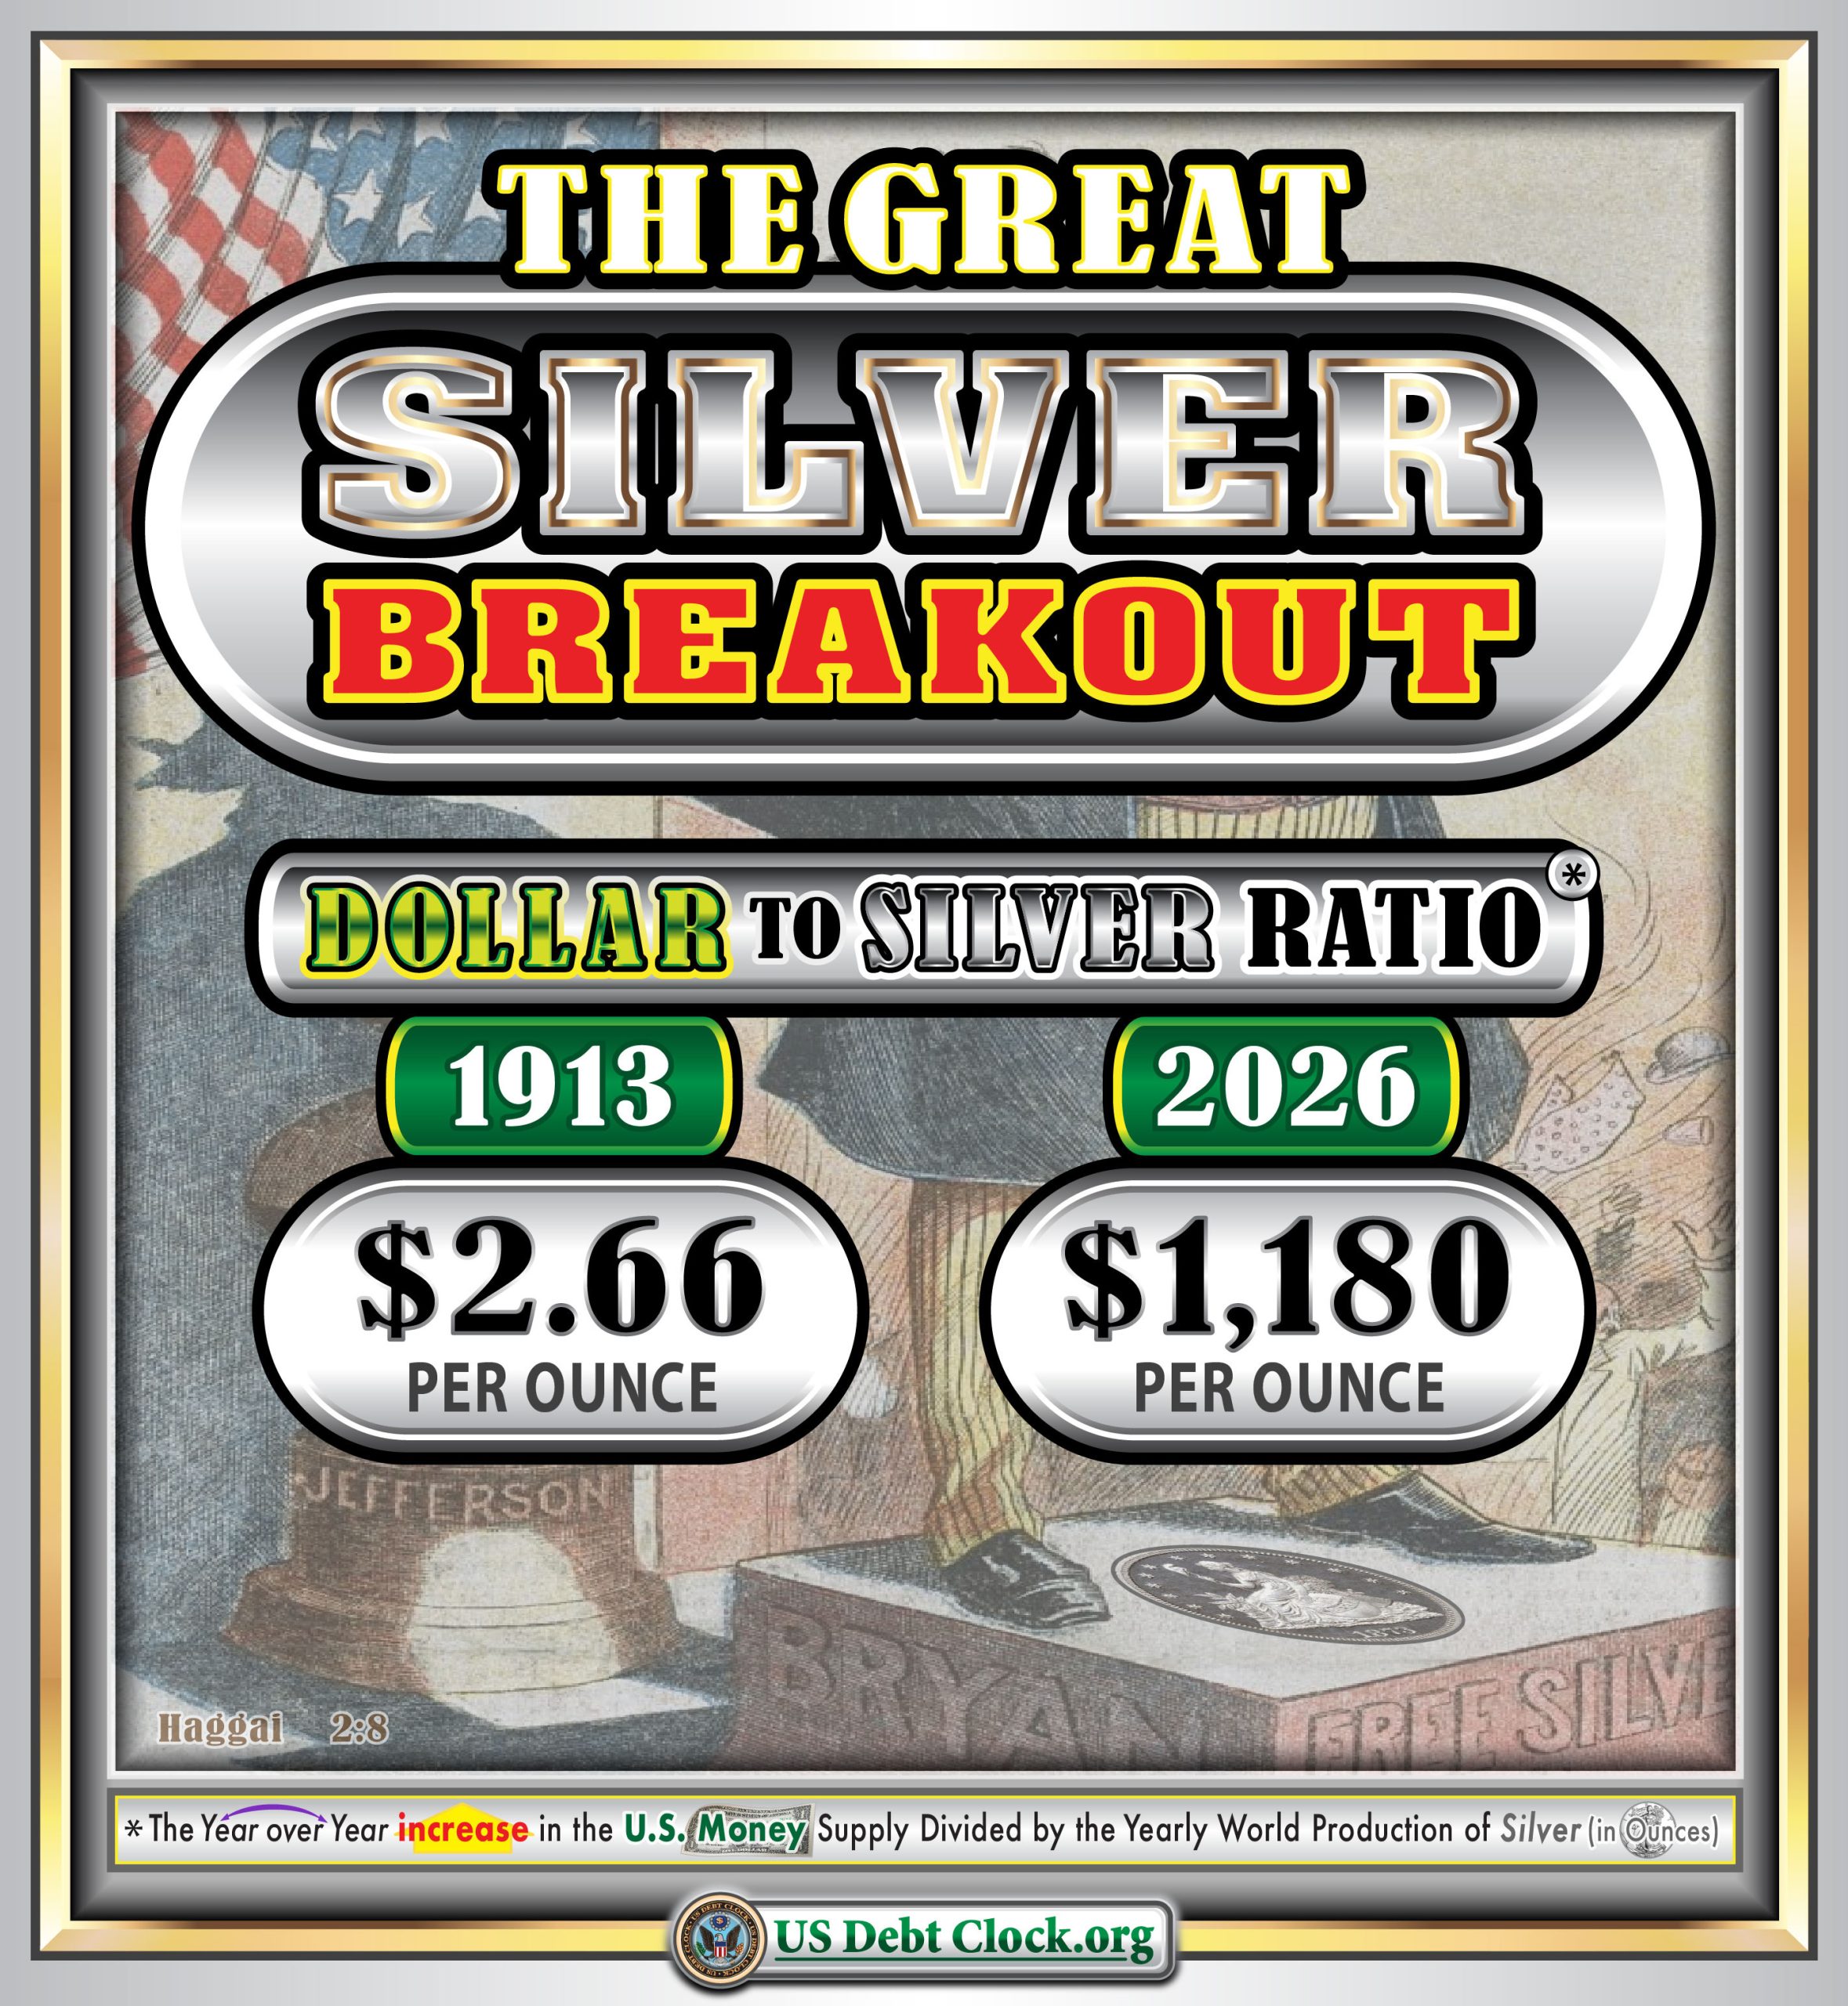
In 1913, the year the Federal Reserve was created, the U.S. dollar-to-silver ratio stood at approximately $2.66 per ounce. That figure wasn’t arbitrary. It reflected a monetary system still tethered, however loosely, to physical reality—where silver circulated as money and paper offering claims against it was limited.
Fast forward to 2026, and that same ratio has exploded to roughly $1,180 per ounce.
This number is not pulled from thin air. It is derived from a simple but devastating calculation:
Year-over-year increases in the U.S. money supply ÷ annual global silver production (in ounces).
In other words, how many new dollars are created each year, divided by how much new silver the world actually produces.
The result exposes a truth that paper markets desperately try to suppress: silver has been massively diluted by currency creation, not overproduced. The metal didn’t become less valuable—the dollar did.
The Monetary Compression No One Is Pricing In
Unlike fiat currency, silver supply is stubbornly finite. Annual global mine production struggles to grow meaningfully, while industrial demand continues to rise—from solar panels and EVs to medical and defense applications. Meanwhile, the money supply expands exponentially, not linearly.
This creates a form of monetary compression: more claims, more currency units, chasing a metal that cannot be printed.
Historically, such compressions resolve violently. They don’t unwind slowly. They snap.
What the U.S. Debt Clock Is Really Signaling
This brings us back to the U.S. Debt Clock, which many dismiss as a political prop or novelty website. That is a mistake.
Buried within the Debt Clock are ratios and counters that quietly track the widening gap between currency, debt, and tangible assets like gold and silver. What it is really signaling is not “too much debt” in isolation—but the end of confidence in debt as money.
When debt grows faster than production, and currency grows faster than resources, the system must eventually reprice real assets upward to restore balance. Silver, historically the people’s money and industrial linchpin, sits at the epicenter of that repricing.
The Debt Clock is not predicting collapse tomorrow. It is signaling inevitability.
Why This Time Is Different for Silver
Silver has always lagged gold in monetary cycles—until it doesn’t. When silver moves, it tends to move faster, harder, and with far more volatility. The current setup is unique:
- Decades of suppressed pricing through paper leverage
- Structural industrial shortages
- Exploding monetary aggregates
- A global trust deficit in sovereign debt
In past cycles, silver reasserted itself as money. In this cycle, it may reassert itself as the bridge between a failing debt-based system and whatever comes next.
The Breakout Is Not Technical—It’s Monetary
This is not just a chart pattern or a speculative trade. The Great Silver Breakout is a monetary event. It is the consequence of 113 years of arithmetic catching up with policy.
From $2.66 per ounce in 1913 to a monetary-equivalent ratio of $1,180 per ounce today, silver has been quietly marking the distance between truth and illusion.
That distance can only close one way.
And when it does, silver will not ask permission.
Leave a Reply