Bitcoin’s late-January 2026 price action delivered a blunt reminder of how fragile heavily leveraged markets can become when sentiment turns. After weeks of elevated optimism, a sharp break below key technical levels unleashed a cascade of forced liquidations—primarily from overextended long positions—pushing Bitcoin into one of its most violent deleveraging episodes of this cycle.
At its depths, Bitcoin briefly traded in the mid-$70,000s before stabilizing near the $84,000 region, but the damage beneath the surface was substantial.
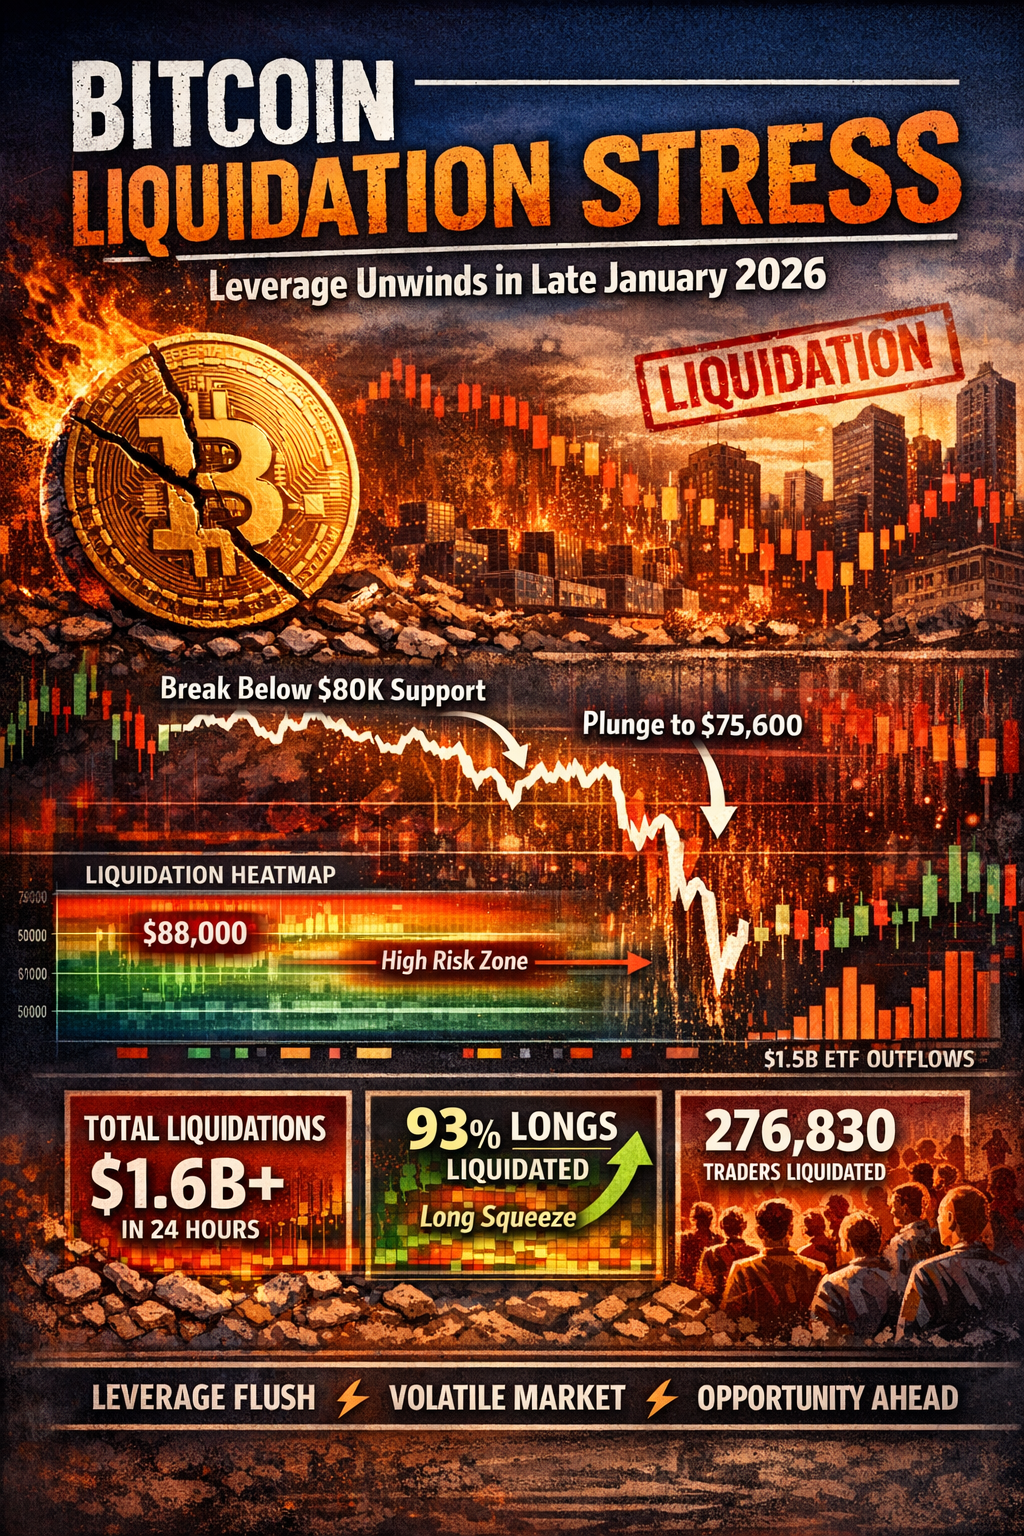
A Liquidation Event Measured in Billions
Across major derivatives venues, total crypto liquidations repeatedly exceeded $1.6–$1.8 billion within 24 hours during the selloff. Bitcoin alone accounted for roughly $768 million or more of these forced closures, underscoring its central role in the downturn.
Even more striking was the composition:
- 93–97% of liquidations were long positions
- Shorts represented less than 10% of total liquidations
This imbalance confirms a classic long squeeze, where overly crowded bullish positioning was systematically unwound as price fell.
In practical terms, traders who expected a continuation toward new all-time highs were forced out en masse as stop-losses and liquidation engines kicked in.
The Technical Line That Snapped
One of the most important triggers was Bitcoin’s decisive loss of the $80,000–$82,500 zone, widely viewed as a “true market mean” and major structural support.
Once this level gave way:
- Liquidations cascaded during thin weekend liquidity
- Spot and derivatives volumes surged toward $75 billion
- Algorithmic selling accelerated price declines
At the same time, ETF outflows approaching $1.5 billion added persistent spot-market pressure, reinforcing the downward momentum.
Leverage Ratios Flash Red
On-chain and exchange-level indicators also signaled danger before the crash:
- Estimated Leverage Ratio (ELR): ~0.188
- Elevated open interest relative to exchange reserves
- Funding rates still strongly positive (around 43% annualized)
This combination—high leverage plus positive funding—suggests traders were aggressively long even as downside risks increased, setting the stage for a violent reset.
What Liquidation Heatmaps Are Showing
Liquidation heatmaps highlight dense clusters of potential forced selling below and above current price, with notable concentrations below $88,000 where roughly $497 million in additional long liquidations could activate.
This means:
- Volatility risk remains elevated
- Sharp wicks in either direction are likely
- Price discovery is still in progress
In other words, the market has not yet reached a low-leverage equilibrium.
Snapshot of the Latest Liquidation Wave
| Metric | Value (Recent 24h Peak) | Longs vs Shorts |
|---|---|---|
| Total Liquidations | $1.6–$1.8B | 93–97% Longs |
| Bitcoin Share | ~$768M+ | Primarily Longs |
| Traders Liquidated | 276,830 | N/A |
Short-Term Pain vs. Long-Term Structure
Year-to-date, Bitcoin is now 11–20% below peaks above $104,000, placing the asset firmly into a corrective phase rather than a trend reversal—at least from a longer-term perspective.
Historically, similar leverage flushes have tended to:
- Reset funding rates
- Reduce open interest
- Transfer coins from weak hands to stronger holders
These phases are uncomfortable, but they often lay the groundwork for the next sustained advance.
What Investors Should Take Away
- Leverage is the enemy of durability
Excessive derivatives exposure amplifies every move. - Spot-driven accumulation matters more than perpetual speculation
Long-term trends are built on real buying, not borrowed conviction. - Volatility creates opportunity—but only for the prepared
Forced selling can produce mispriced assets for disciplined investors.
The Bigger Picture
Bitcoin remains a macro asset tied to global liquidity, real yields, and capital rotation. The late-January liquidation storm does not invalidate the long-term thesis—but it does expose the fragility of speculative excess.
For seasoned market participants, this episode looks less like a death spiral and more like a necessary detox.
As leverage bleeds out, the foundation for the next major leg higher quietly begins forming.
Invest Offshore continues to track digital-asset market structure, offshore custody strategies, and alternative investment opportunities across emerging markets. We also have investment opportunities in West Africa seeking investors for the Copperbelt Region.
Leave a Reply