
Gold and silver may command the headlines, but the commodity story is becoming much bigger. Across industrial metals and agricultural markets, the accompanying chart points to an expanding advance—one that deserves attention from investors watching inflation, global production, and the purchasing power of capital.
The central message is simple: major commodity cycles rarely move in isolation. Different markets respond at different speeds, but they share connections through energy costs, investment, supply constraints, currencies, and physical demand.
When more of those markets begin moving higher together, the breadth of the move matters.

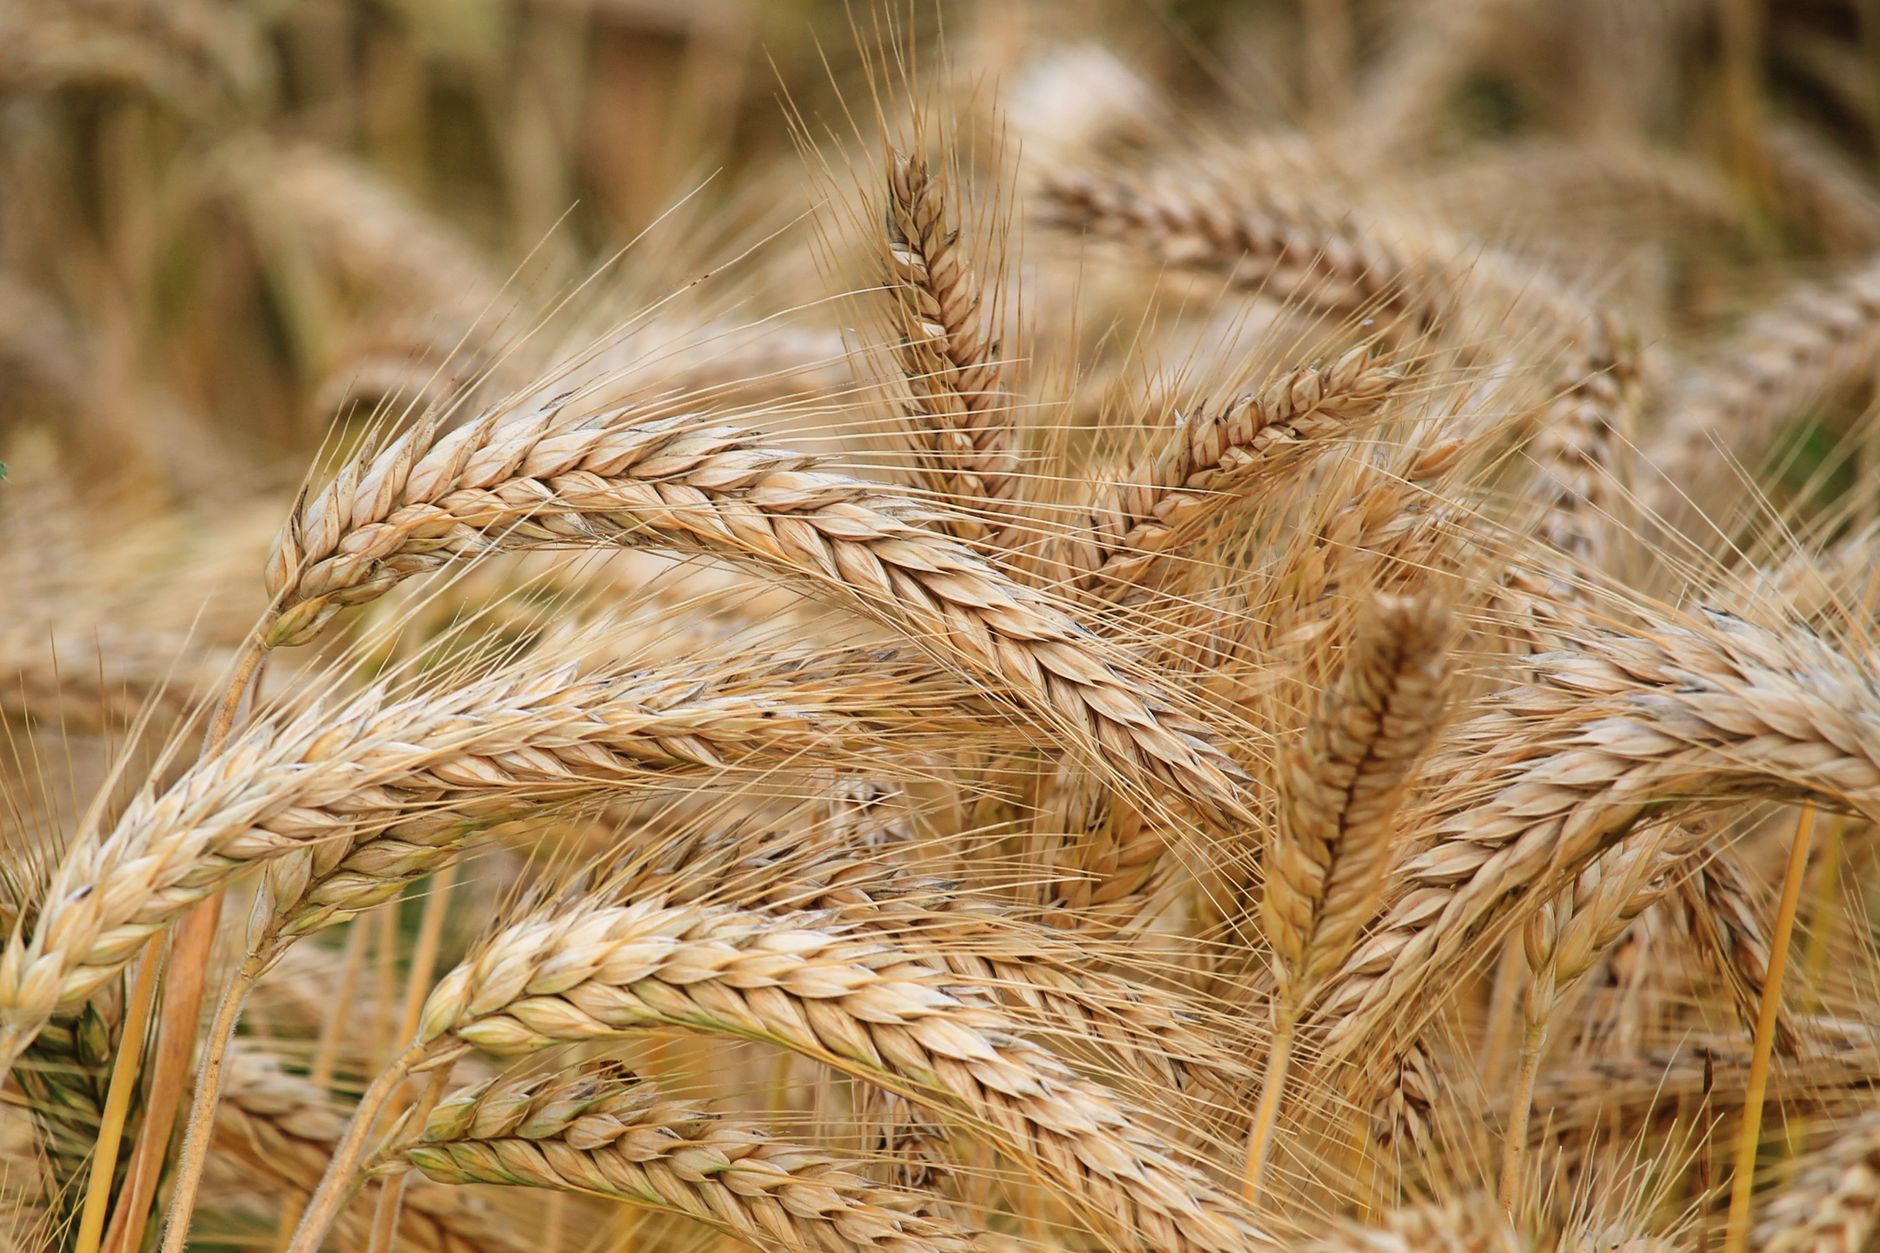
The chart captures that widening participation. Its agricultural panel—labelled “soft commodities”—shows rice, wheat, soybeans, and corn finishing above their October 2025 starting levels, with pronounced advances into 2026. Wheat, rice, and soybeans show particularly strong gains, while corn participates more unevenly.
The industrial panel tells a similar story across a different period. Iron & steel and tin lead the displayed gains, copper trends substantially higher, and zinc and aluminum also finish well above their starting levels.
These are indexed series, rather than dollar prices. The agricultural panel starts at 100 in October 2025 and uses daily closes; the metals panel starts at 100 in January 2025 and uses weekly closes. Their percentage gains therefore should not be treated as returns over identical periods. Nevertheless, the broadening strength is visible across both panels.
Copper brings an industrial dimension to a market discussion often dominated by precious metals. Electricity networks, machinery, construction, and transport all require copper. Zinc connects the cycle to galvanized steel and infrastructure, while aluminum and tin extend it into manufacturing and electronics.
Independent research supports parts of that picture. In June, the World Bank reported that its metals and minerals index had risen about 20% since the beginning of 2026, reaching a record nominal monthly level in May. It identified supply disruptions and resilient demand, including investment in power grids and digital infrastructure, as important drivers. World Bank, June 2026
Iron and steel add another layer. Their strength in the supplied chart broadens the visual story beyond the metals most closely associated with electrification. But the category requires care: an “iron & steel” series is not interchangeable with a benchmark iron ore price. The same World Bank analysis forecast weaker iron ore prices because of ample supply—a useful reminder that even an expanding commodity advance contains exceptions.
Agriculture makes the picture more consequential for the wider economy. Rising grain and oilseed prices affect food processors, livestock producers, household budgets, and importing countries. Weather and harvest conditions can drive individual crops, but agriculture also shares important costs with the rest of the commodity complex.
Farms consume fuel. Fertilizer production depends on energy. Crops must be transported, dried, processed, and stored. Higher costs can spread through these connections, although crop prices still depend on harvests, inventories, and demand.
That makes energy essential to the broader argument, even though it is not plotted in the accompanying chart.
Oil, natural gas, and electricity influence the cost of extracting metals, operating smelters, producing fertilizer, and moving goods. Energy can therefore transmit pressure between markets that initially appear unrelated. In its April 2026 outlook, the World Bank projected a 24% increase in energy prices and a 31% increase in fertilizer prices for the year, reflecting disruptions associated with the Middle East conflict. Those were conditional forecasts, but they illustrate how an energy shock can spread across the commodity economy. World Bank, April 2026
For Invest Offshore readers, this broader perspective matters because commodity exposure crosses borders. Resource producers, agricultural exporters, industrial importers, and energy-dependent economies experience rising prices differently. Export revenues may improve in one market while input costs squeeze businesses in another.
The same distinction applies to investments. A higher commodity price does not automatically mean higher profits for every producer. Operating costs, debt, taxation, currency movements, and political conditions can absorb the benefit. Owning several commodity businesses also may provide less diversification than expected when they depend on the same global cycle.
The chart strengthens the case for looking beyond gold and silver. It does not, by itself, establish a lasting supercycle or guarantee that every commodity will keep rising. The next evidence to watch is whether participation persists through corrections and whether physical demand and supply conditions support the advance.
Major cycles rarely move in isolation, but they rarely move in perfect unison either. Gold and silver remain part of the story. Copper, zinc, iron and steel, agriculture, and energy make the story larger—and increasingly relevant to the global investor.
Leave a Reply