
Copper is no longer simply an industrial metal. It is becoming strategic infrastructure—and the map of the world’s biggest mines shows just how concentrated that infrastructure has become.
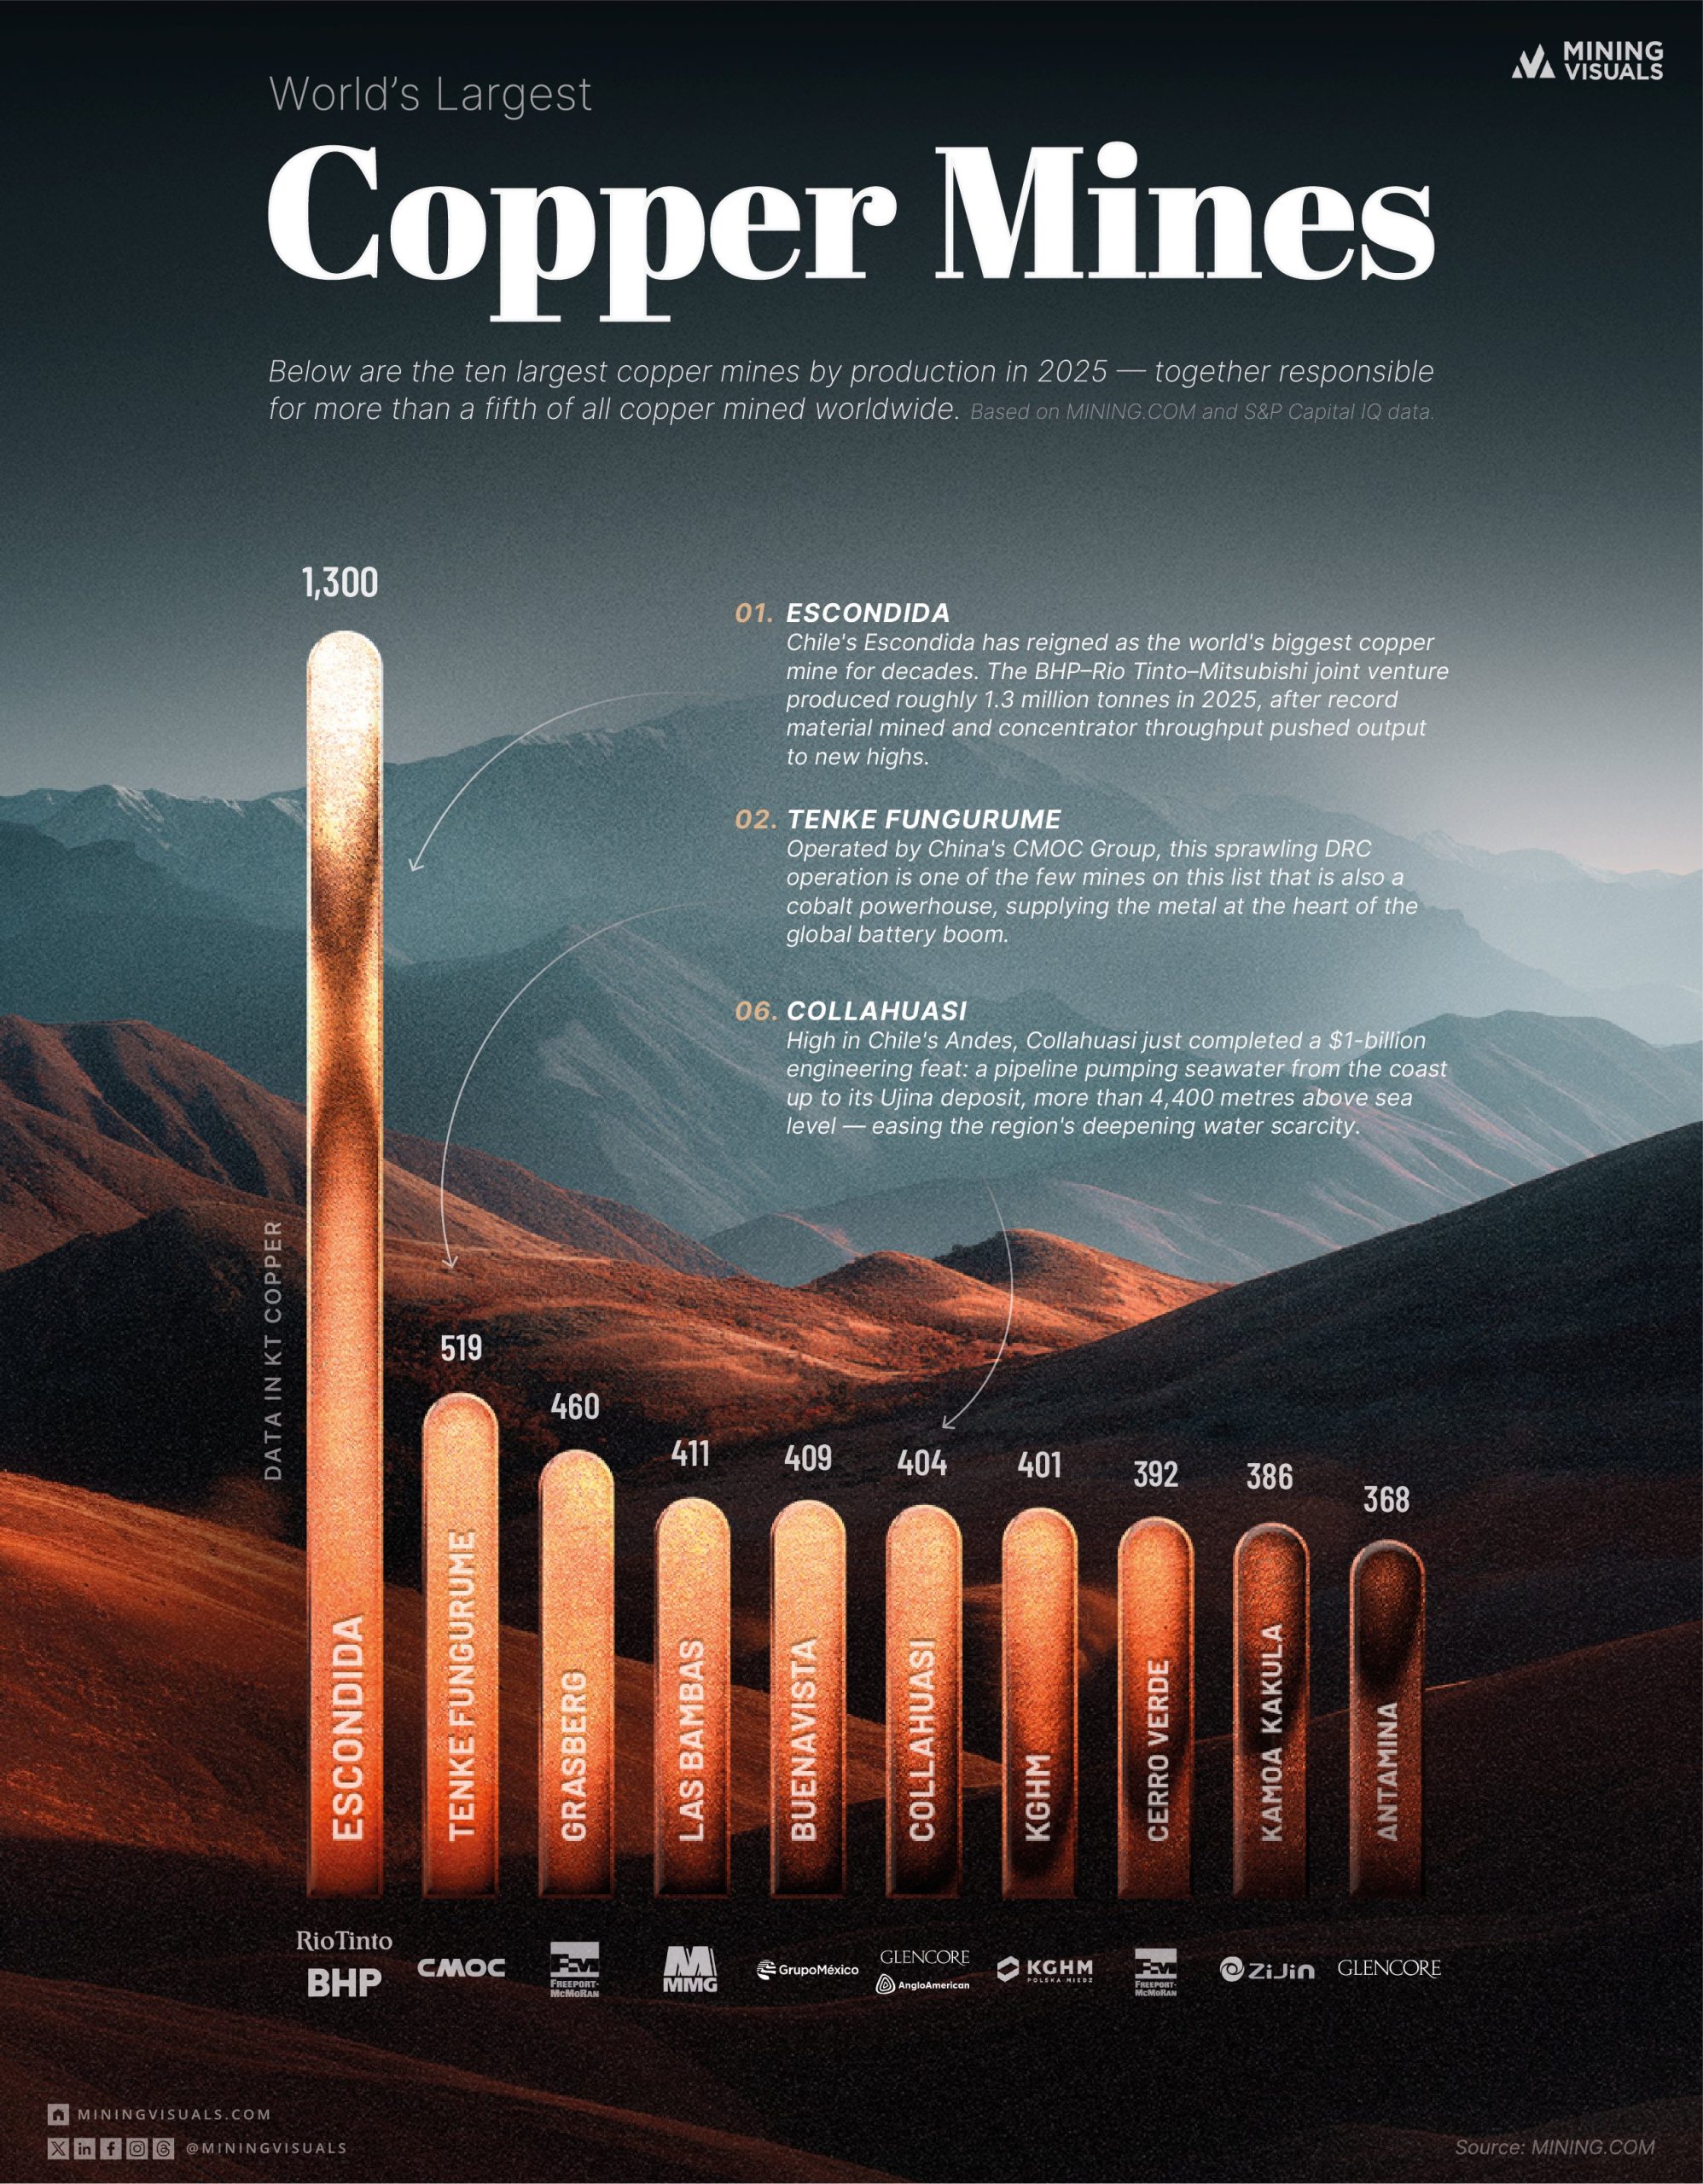
The latest visualization from MiningVisuals offers a striking snapshot of the 10 largest copper-producing mines and mining complexes in 2025. Together, these operations produced roughly 4.9 million tonnes of copper—more than one-fifth of all copper mined worldwide. Just six countries account for the entire top ten. MiningVisuals
For investors watching electrification, artificial intelligence, power grids, electric vehicles, defense manufacturing and the modernization of emerging economies, that concentration matters.
Copper may trade globally, but the metal itself still has to come out of a very small number of holes in the ground.
And one mine towers above all the others.
Escondida Remains in a League of Its Own
Chile’s Escondida continues to reign as the largest copper mine on Earth.
The MiningVisuals graphic rounds 2025 production to approximately 1.3 million tonnes, while the underlying ranking puts production at about 1.348 million tonnes. That is more than two-and-a-half times the output of the second-place operation, Tenke Fungurume. MiningVisuals
Escondida is operated by BHP and owned through a joint venture involving BHP, Rio Tinto and Japanese interests. Its extraordinary scale illustrates something increasingly important about the copper market: the world’s biggest individual deposits can have almost sovereign-level importance to global supply.
BHP has described Escondida’s recent performance as its strongest in 17 years, with copper volumes rising sharply. MarketScreener
When a single mine can produce more copper than the entire output of many mining countries, operational performance in Chile can affect markets thousands of miles away.
The 2025 Copper Heavyweights
Using the figures presented in the MiningVisuals infographic, the production hierarchy looks like this:
| Rank | Mine / Complex | Country | 2025 Copper Production |
|---|---|---|---|
| 1 | Escondida | Chile | ~1,300 kt |
| 2 | Tenke Fungurume | Democratic Republic of Congo | 519 kt |
| 3 | Grasberg | Indonesia | 460 kt |
| 4 | Las Bambas | Peru | 411 kt |
| 5 | Buenavista | Mexico | 409 kt |
| 6 | Collahuasi | Chile | 404 kt |
| 7 | KGHM Polish Operations* | Poland | 401 kt |
| 8 | Cerro Verde | Peru | 392 kt |
| 9 | Kamoa-Kakula | Democratic Republic of Congo | 386 kt |
| 10 | Antamina | Peru | 368 kt |
*The KGHM entry represents the company’s integrated Polish copper mining operations rather than one individual pit. MiningVisuals notes that production comes principally from the Lubin, Rudna and Polkowice-Sieroszowice underground mines. MiningVisuals
The geographical pattern is almost as interesting as the tonnage.
Chile has two entries. Peru has three. The Democratic Republic of Congo has two. Indonesia, Mexico and Poland supply the remaining three.
Six countries therefore sit beneath more than one-fifth of global mined copper production. MiningVisuals
That is an extraordinary degree of concentration for a metal increasingly viewed as indispensable to the next generation of the global economy.
The DRC Has Become Impossible to Ignore
Perhaps the biggest geopolitical story in the ranking is not Chile but the Democratic Republic of Congo.
Tenke Fungurume ranks second globally at roughly 519,000 tonnes, while Kamoa-Kakula also makes the top ten.
The DRC was already central to the world’s cobalt supply. Its emergence as a copper superpower gives the country even greater leverage within the battery, electrical and industrial supply chains.
Tenke Fungurume is controlled by China’s CMOC, illustrating China’s growing position not merely as a buyer and refiner of critical minerals but as an owner and operator of upstream mineral assets.
The scale is remarkable. U.S. Geological Survey data show Congolese mined copper production reached nearly 3 million tonnes in 2024, after years of rapid expansion. US Geological Survey
The investment implication goes well beyond copper prices.
Western governments attempting to secure critical-mineral supply chains are increasingly confronting a reality that Invest Offshore readers understand well: ownership, jurisdiction, financing and trade corridors can matter just as much as geology.
Peru Quietly Places Three Mines in the Top Ten
Peru may receive less attention than Chile in the popular copper narrative, yet the ranking shows its enormous importance.
Las Bambas, Cerro Verde and Antamina all appear among the ten largest producers.
That makes Peru one of the most strategically important copper jurisdictions anywhere in the world.
And it highlights the opportunities—and risks—that accompany large-scale mining in Latin America: political changes, community relations, taxation, environmental regulation, logistics and infrastructure can all influence a commodity market supposedly determined by global supply and demand.
Copper does not exist in a geopolitical vacuum.
A mine can contain billions of dollars of mineral wealth and still depend on roads, ports, water, electricity, permits, labor agreements and political stability to transform that ore into deliverable metal.
Copper Meets the AI Electricity Boom
There is another reason this ranking deserves attention in 2026.
The copper story has expanded far beyond electric vehicles.
AI data centers are demanding enormous amounts of electricity. Electricity requires transmission. Transmission requires transformers, switchgear, substations, wiring and expanded grids.
All of them require copper.
Renewable generation requires copper.
Electric vehicles require copper.
Charging networks require copper.
Industrial automation requires copper.
Modern military systems require copper.
And the expansion of electricity consumption throughout Asia, Africa and Latin America requires enormous quantities of copper even before the AI revolution is considered.
MiningVisuals reported that copper reached an intraday COMEX high of $6.71 per pound on May 13, 2026, while citing an International Copper Study Group forecast for a 150,000-tonne copper deficit in 2026. MiningVisuals
That puts the top-ten ranking into perspective.
The world is asking for more copper at precisely the moment that an extraordinary portion of supply depends upon a comparatively small collection of giant, mature mining operations.
The Offshore Angle: Copper Is Also a Jurisdictional Asset
For Invest Offshore, the chart has another lesson.
The value of a copper mine is not determined solely by the copper underground.
It also depends on which government controls the ground, which companies own the mine, which currency finances its development, where the concentrate is processed, who owns the smelters, which ports handle exports and which banking system clears the proceeds.
Many of the world’s largest copper operations are joint ventures involving global mining majors, state enterprises and strategic Asian investors. MiningVisuals notes that Escondida, Antamina, Collahuasi, Grasberg, Las Bambas, Cerro Verde and Kamoa-Kakula all involve multi-party ownership structures. MiningVisuals
That means copper is increasingly a study in cross-border capital.
A tonne of copper may begin beneath Chilean rock, be owned partly by Australian, British or Japanese capital, be priced through London or New York, be refined elsewhere and ultimately end up inside an American data center or Chinese electrical network.
This is globalization in its most physical form.
Where Is the United States?
One feature of the graphic should immediately catch an American investor’s eye:
There is no U.S. mine in the top ten.
For the world’s largest economy—and one embarking on enormous investment in AI infrastructure, manufacturing, defense and electrical-grid modernization—that absence deserves attention.
North America has copper resources. What it increasingly struggles with is the lengthy process required to discover, permit, finance and construct major new mines.
Unlike software, copper production cannot be scaled by adding servers.
A new world-class mine can require billions of dollars and many years—sometimes decades—from discovery through permitting, construction and commercial production.
That makes existing large mines exceptionally valuable.
It also makes undeveloped deposits in politically stable jurisdictions strategically interesting long before they actually enter production.
The Next Copper Super-Mine Matters
The MiningVisuals chart is therefore more than a ranking of mining operations.
It is a map of economic power.
Escondida demonstrates the immense value of scale. The DRC demonstrates the changing geopolitical center of mineral production. Peru demonstrates Latin America’s continuing importance. And the absence of the United States from the list demonstrates the challenge facing countries seeking domestic mineral security.
Most importantly, the chart shows how little redundancy exists at the very top of global copper production.
The ten largest operations supply more than 20% of the world’s mined copper. MiningVisuals
When demand is rising, that concentration becomes increasingly important.
When supply is disrupted, it becomes dangerous.
And when governments begin treating copper as a strategic resource rather than merely another traded commodity, ownership of the world’s great deposits takes on an entirely different meaning.
The 21st century may run on software—but the electricity beneath that software still runs through copper.
For investors, miners and governments alike, the race is therefore no longer simply about finding the next Escondida.
It is about who finances it, who owns it, which jurisdiction controls it—and who ultimately gets the copper.
Image Source: MiningVisuals, World’s Largest Copper Mines — 2025 Production, based on MINING.COM and S&P Capital IQ data. MiningVisuals
View the original MiningVisuals post on X
MiningVisuals: Ranked — The World’s Largest Copper Mines (2025)
Leave a Reply